PBS NewsHour
Elections Calculator
2020 · Software Engineer
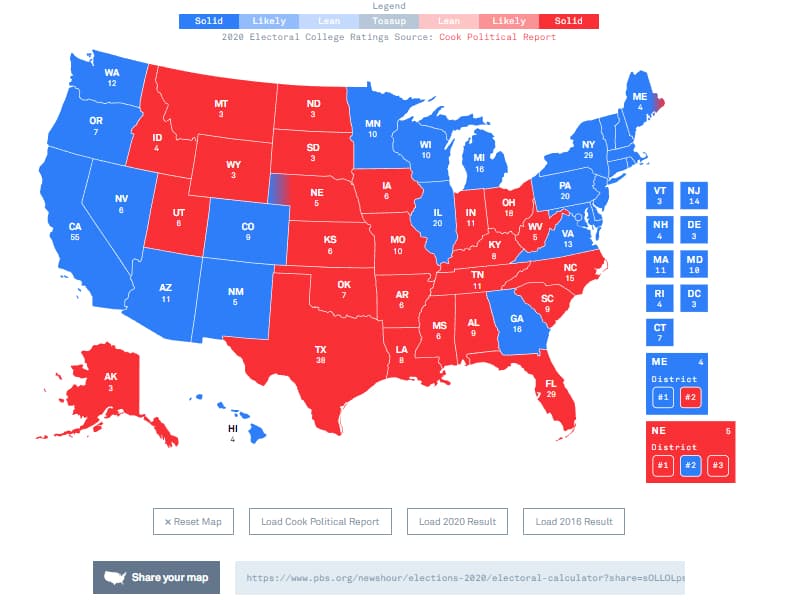
An interactive that let viewers map their own paths to 270, syncing with live results as the night unfolded.
InteractiveData viz
About the client
PBS NewsHour is a public broadcast news program that provides in-depth coverage and analysis.
What we did
I developed an interactive Electoral College map for PBS NewsHour ahead of the 2020 election. The tool allows users to explore election outcomes and understand the Electoral College dynamics.
Key features
- Scenario building: Toggle projected electoral votes for each candidate.
- State ratings: Start with projected state ratings from the Cook Political Report.
- Victory path visualization: Calculate electoral totals based on user selections.
- Shareable maps: Generate custom URLs for easy sharing and discussion.
Impact
The Electoral College Calculator became a popular tool, helping viewers engage with election complexities and visualize potential outcomes.