Hurricane Tracker
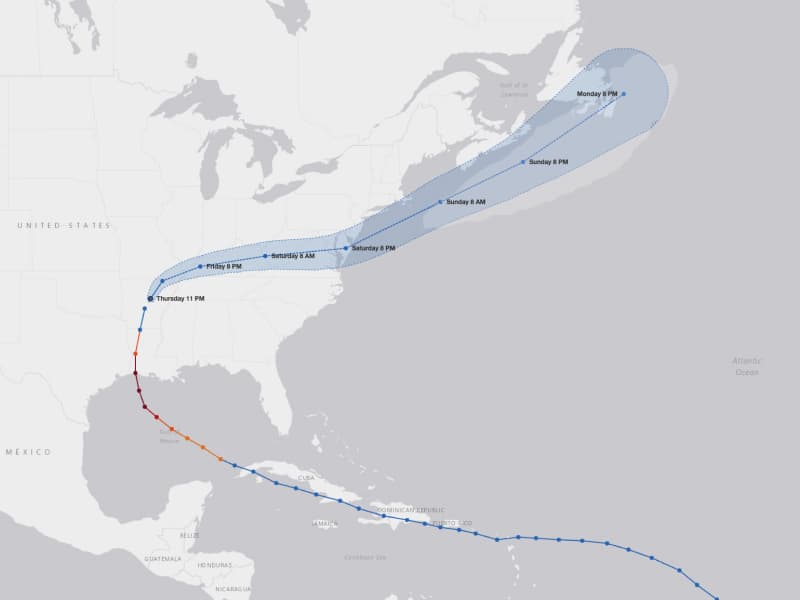
In this project, I wanted to improve our online reporting of hurricanes for PBS NewsHour by building out an interactive map. Using Leaflet.js, This map retrieves and displays the latest projected storm paths and wind speed probability directly from NOAA, providing viewers with a clear and engaging way to understand the potential impact of these destructive events.
See it: LIVE MAP: Track Hurricane Laura after landfall
Key Features:
- Real-time Data: Leverages official NOAA data feeds to ensure users access the most up-to-date hurricane track information.
- Interactive Experience: The user is able to zoom, pan, and explore details of the projected paths.
- Clear Visualization: Employs intuitive design elements to effectively communicate the storm's intensity, location, and movement.
- Integration with PBS NewsHour: seamlessly integrates with existing news content, enriching the user experience and providing valuable context.
Technical Skills Demonstrated:
- Web Development: Expertise in HTML, CSS, and JavaScript, particularly frameworks like Leaflet.js for interactive mapping.
- Data Acquisition: Ability to extract data from APIs, and less standardized formats, and integrate it into web applications.
- Visualization Design: Knowledge of best practices for presenting geographical data in an informative and visually appealing way.
Impact:
- Enhanced User Engagement: Increased audience engagement with hurricane coverage by providing an interactive and dynamic visualization.
- Improved Information Accessibility: Made complex storm data more easily understandable for a wider audience.
- Strengthened Reporting: Contributed to PBS NewsHour's mission of providing comprehensive and informative coverage of breaking news.
Company PBS NewsHour